大型语言模型中的解码策略

在大型语言模型 (LLM) 中,大多数关注点都在模型架构、数据处理和优化上。然而,集束搜索等解码策略在文本生成中扮演着至关重要的角色,却常常被忽视。本文将通过深入探讨贪婪搜索和集束搜索的机制,以及 Top-k 采样和核采样等采样技术,来探索 LLM 如何生成文本。
阅读本文后,您将了解这些解码策略的工作原理,以及如何调整温度 (temperature)、光束数 (num_beams)、top_k 和 top_p 等重要参数。
本文的代码可在 GitHub 和 Google Colab 上找到,以供参考和进一步探索。
📚 背景
首先,让我们从一个例子开始。我们将把文本“我有一个梦想”输入到 GPT-2 模型中,并要求它生成接下来的五个标记(单词或子单词)。
from transformers import GPT2LMHeadModel, GPT2Tokenizer
import torch

device = 'cuda' if torch.cuda.is_available() else 'cpu'
model = GPT2LMHeadModel.from_pretrained('gpt2').to(device)
tokenizer = GPT2Tokenizer.from_pretrained('gpt2')
model.eval()

text = "I have a dream"
input_ids = tokenizer.encode(text, return_tensors='pt').to(device)

outputs = model.generate(input_ids, max_length=len(input_ids.squeeze())+5)
generated_text = tokenizer.decode(outputs[0], skip_special_tokens=True)
print(f"Generated text: {generated_text}")
生成的文本:“我有一个梦想是成为一名医生。”
句子“我有一个梦想是成为一名医生”似乎是由 GPT-2 生成的。然而,GPT-2 并没有*完全*生成这个句子。
人们普遍误认为像 GPT-2 这样的 LLM 会**直接生成文本**。事实并非如此。相反,LLM 会计算 logit,即为其词汇表中每个可能的标记分配的分数。为简化起见,下面是该过程的说明性细分:
分词器(此处为 字节对编码)将输入文本中的每个标记转换为相应的标记 ID。然后,GPT-2 使用这些标记 ID 作为输入,并尝试预测下一个最可能的标记。最后,模型生成 logit,通过 softmax 函数将其转换为概率。
例如,模型为“of”标记分配了 17% 的概率,使其成为“I have a dream”之后的下一个标记。此输出本质上代表了序列中潜在的下一个标记的排名列表。更正式地,我们将此概率表示为 $P(\text{of } | \text{ I have a dream}) = 17\%$。
像 GPT 这样的自回归模型根据前面的标记预测序列中的下一个标记。考虑一个标记序列 $w = (w_1, w_2, \ldots, w_t)$。此序列的联合概率 $P(w)$ 可以分解为
对于序列中的每个标记 $w_i$, $P(w_i | w_1, \ldots, w_{i-1})$ 表示在给定所有前导标记 $(w_1, \ldots, w_{i-1})$ 的情况下,$w_i$ 的条件概率。GPT-2 计算其词汇表中 50,257 个标记的这个条件概率。
这就引出了一个问题:我们如何使用这些概率来生成文本?这就是解码策略(例如贪婪搜索和集束搜索)发挥作用的地方。
🏃♂️ 贪婪搜索
贪婪搜索是一种解码方法,它在每个步骤中选择概率最高的标记作为序列中的下一个标记。简单来说,它在每个阶段只保留最可能的标记,而丢弃所有其他可能的选项。以我们的例子为例:
步骤 1:输入:“我有一个梦想”→最可能的标记:“的”
步骤 2:输入:“我有一个梦想的”→最可能的标记:“是”
步骤 3:输入:“我有一个梦想的是”→最可能的标记:“一”
步骤 4:输入:“我有一个梦想的是一”→最可能的标记:“医生”
步骤 5:输入:“我有一个梦想是成为一名医生”→最可能的标记:“。”
虽然这种方法听起来很直观,但需要注意的是,贪婪搜索是短视的:它只考虑每个步骤中最可能的标记,而不考虑对序列的整体影响。这种特性使其快速高效,因为它不需要跟踪多个序列,但这也意味着它可能会错过通过稍微不那么可能的下一个标记出现的更好序列。
接下来,我们将使用 graphviz 和 networkx 来演示贪婪搜索的实现。我们选择分数最高的 ID,计算其对数概率(我们取对数以简化计算),并将其添加到树中。我们将重复此过程,生成五个标记。
import matplotlib.pyplot as plt
import networkx as nx
import numpy as np
import time

def get_log_prob(logits, token_id):
    # Compute the softmax of the logits
    probabilities = torch.nn.functional.softmax(logits, dim=-1)
    log_probabilities = torch.log(probabilities)

    # Get the log probability of the token
    token_log_probability = log_probabilities[token_id].item()
    return token_log_probability

def greedy_search(input_ids, node, length=5):
    if length == 0:
        return input_ids

    outputs = model(input_ids)
    predictions = outputs.logits

    # Get the predicted next sub-word (here we use top-k search)
    logits = predictions[0, -1, :]
    token_id = torch.argmax(logits).unsqueeze(0)

    # Compute the score of the predicted token
    token_score = get_log_prob(logits, token_id)

    # Add the predicted token to the list of input ids
    new_input_ids = torch.cat([input_ids, token_id.unsqueeze(0)], dim=-1)

    # Add node and edge to graph
    next_token = tokenizer.decode(token_id, skip_special_tokens=True)
    current_node = list(graph.successors(node))[0]
    graph.nodes[current_node]['tokenscore'] = np.exp(token_score) * 100
    graph.nodes[current_node]['token'] = next_token + f"_{length}"

    # Recursive call
    input_ids = greedy_search(new_input_ids, current_node, length-1)

    return input_ids

# Parameters
length = 5
beams = 1

# Create a balanced tree with height 'length'
graph = nx.balanced_tree(1, length, create_using=nx.DiGraph())

# Add 'tokenscore', 'cumscore', and 'token' attributes to each node
for node in graph.nodes:
    graph.nodes[node]['tokenscore'] = 100
    graph.nodes[node]['token'] = text

# Start generating text
output_ids = greedy_search(input_ids, 0, length=length)
output = tokenizer.decode(output_ids.squeeze().tolist(), skip_special_tokens=True)
print(f"Generated text: {output}")
生成的文本:“我有一个梦想是成为一名医生。”
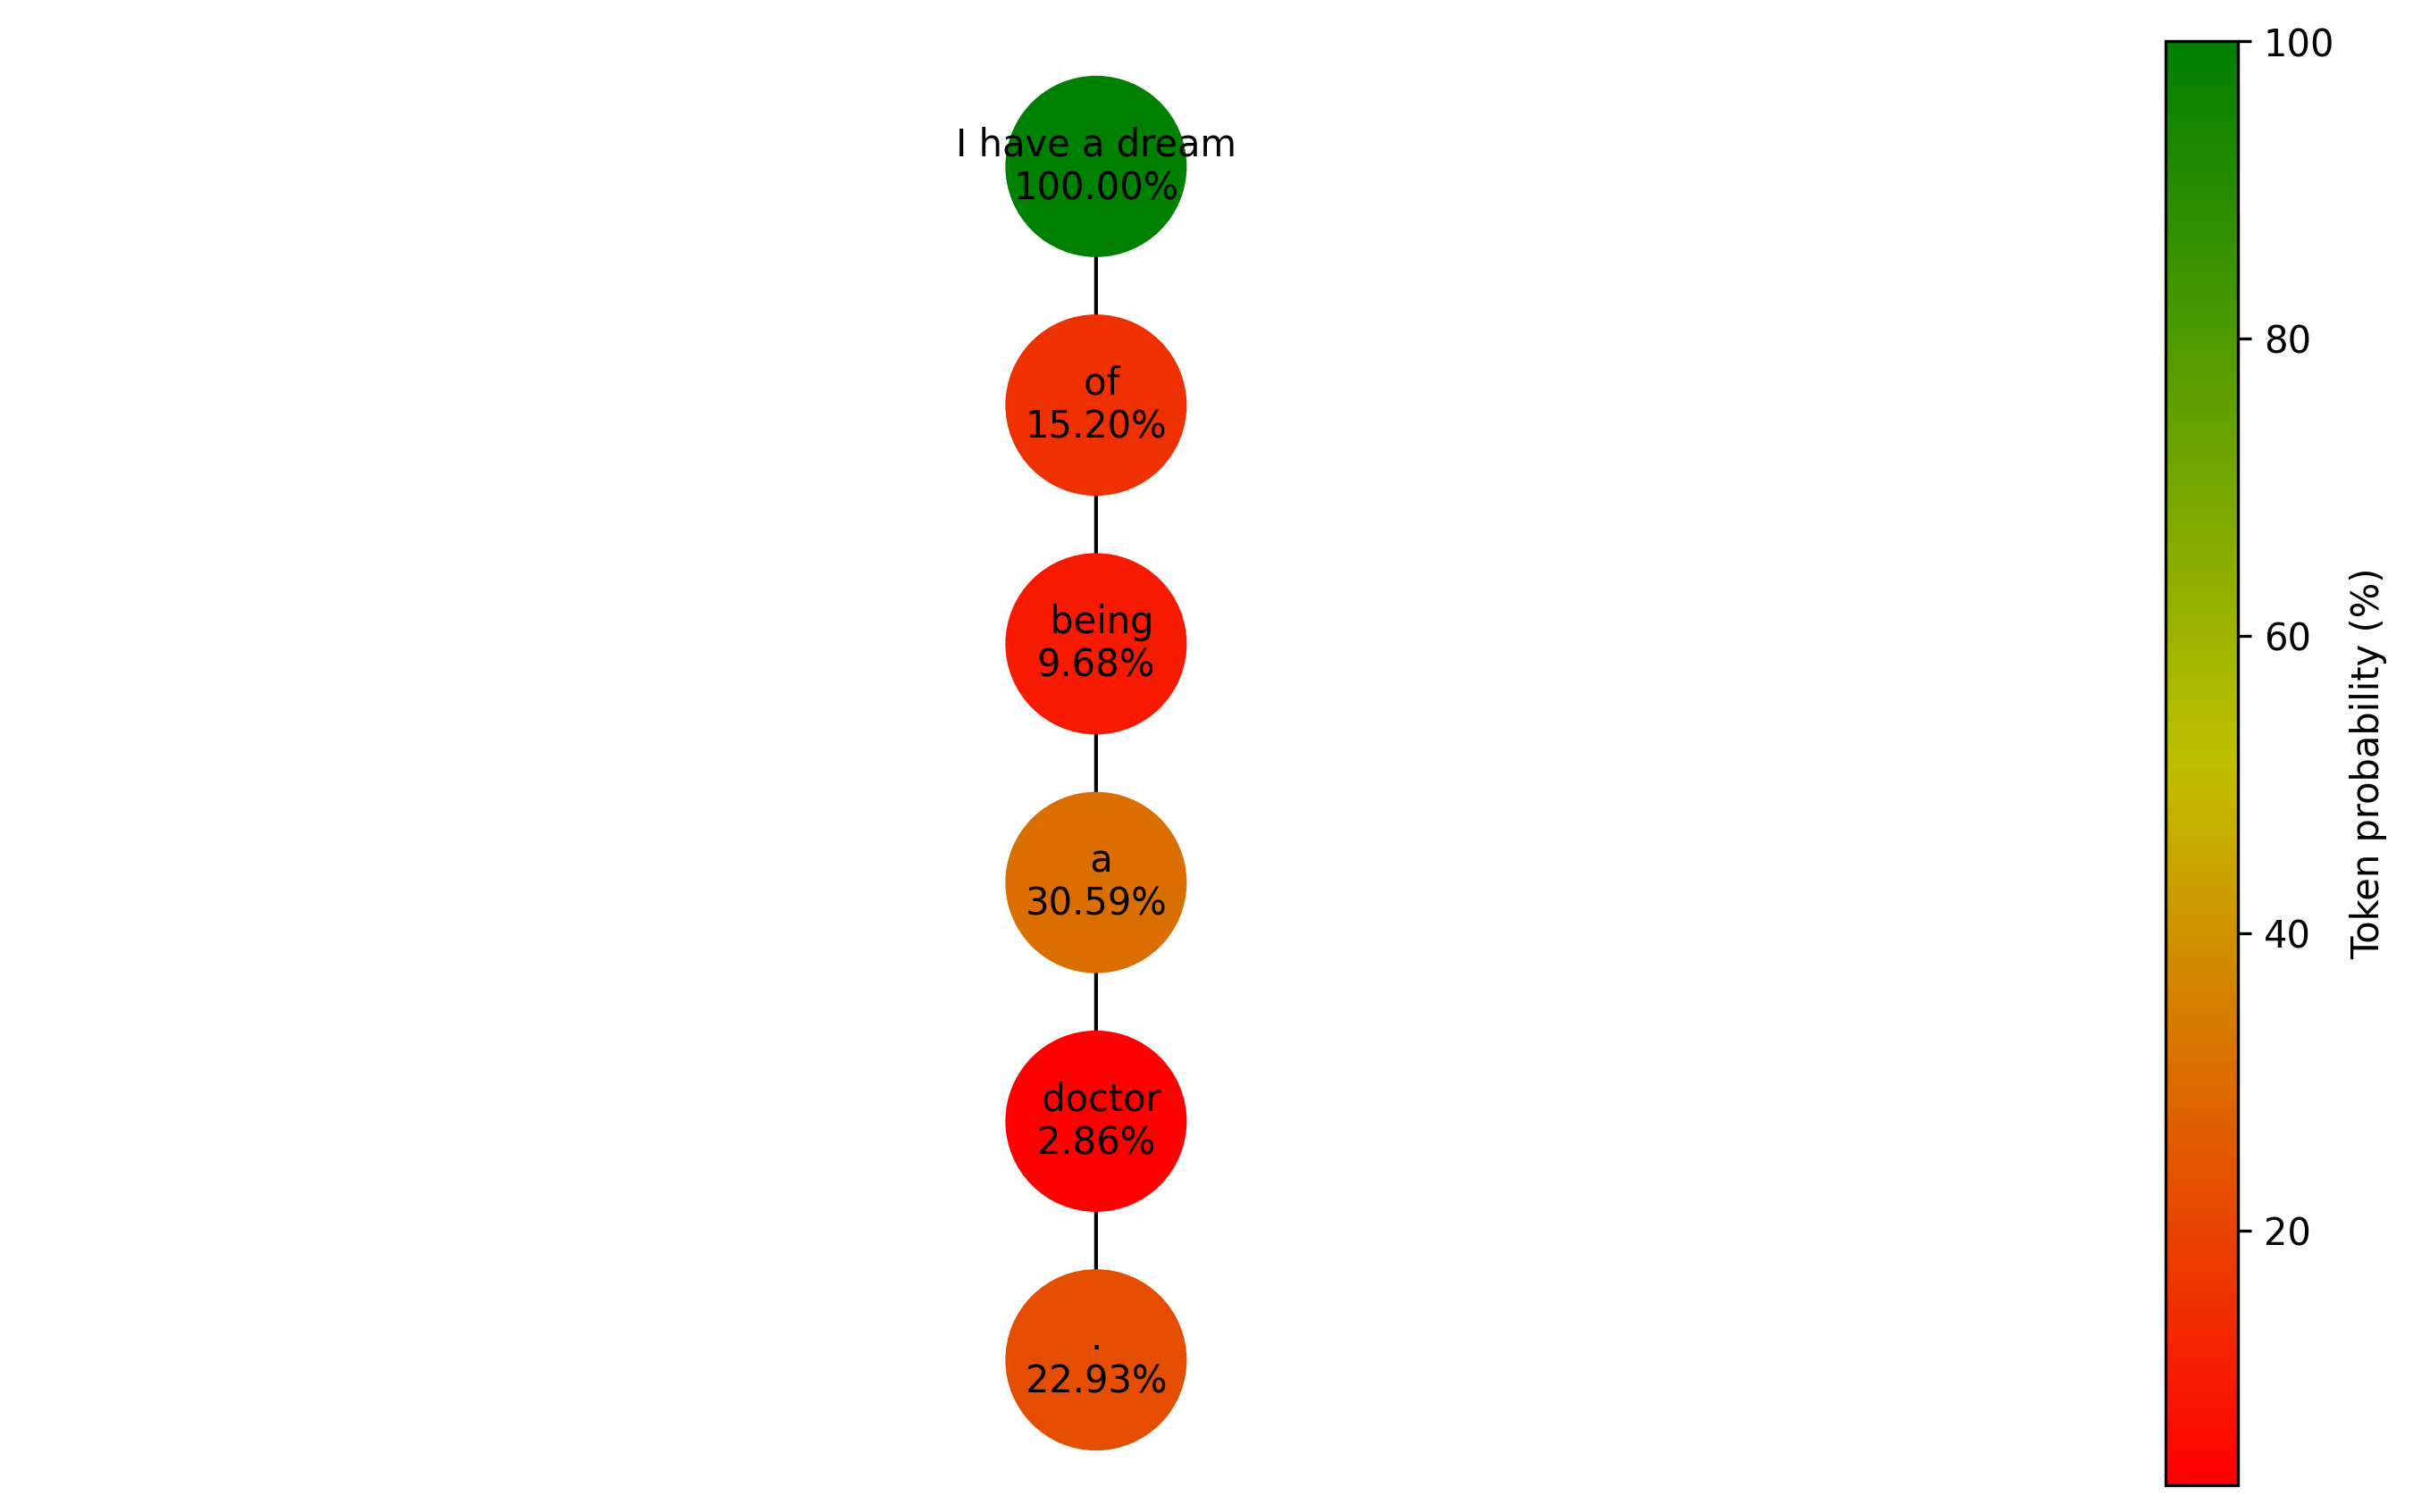
我们的贪婪搜索生成了与 transformers 库中相同的文本:“我有一个梦想是成为一名医生。” 让我们可视化我们创建的树。
    import matplotlib.pyplot as plt
    import networkx as nx
    import matplotlib.colors as mcolors
    from matplotlib.colors import LinearSegmentedColormap

    def plot_graph(graph, length, beams, score):
        fig, ax = plt.subplots(figsize=(3+1.2*beams**length, max(5, 2+length)), dpi=300, facecolor='white')

        # Create positions for each node
        pos = nx.nx_agraph.graphviz_layout(graph, prog="dot")

        # Normalize the colors along the range of token scores
        if score == 'token':
            scores = [data['tokenscore'] for _, data in graph.nodes(data=True) if data['token'] is not None]
        elif score == 'sequence':
            scores = [data['sequencescore'] for _, data in graph.nodes(data=True) if data['token'] is not None]
        vmin = min(scores)
        vmax = max(scores)
        norm = mcolors.Normalize(vmin=vmin, vmax=vmax)
        cmap = LinearSegmentedColormap.from_list('rg', ["r", "y", "g"], N=256)

        # Draw the nodes
        nx.draw_networkx_nodes(graph, pos, node_size=2000, node_shape='o', alpha=1, linewidths=4,
                              node_color=scores, cmap=cmap)

        # Draw the edges
        nx.draw_networkx_edges(graph, pos)

        # Draw the labels
        if score == 'token':
            labels = {node: data['token'].split('_')[0] + f"\n{data['tokenscore']:.2f}%" for node, data in graph.nodes(data=True) if data['token'] is not None}
        elif score == 'sequence':
            labels = {node: data['token'].split('_')[0] + f"\n{data['sequencescore']:.2f}" for node, data in graph.nodes(data=True) if data['token'] is not None}
        nx.draw_networkx_labels(graph, pos, labels=labels, font_size=10)
        plt.box(False)

        # Add a colorbar
        sm = plt.cm.ScalarMappable(cmap=cmap, norm=norm)
        sm.set_array([])
        if score == 'token':
            fig.colorbar(sm, ax=ax, orientation='vertical', pad=0, label='Token probability (%)')
        elif score == 'sequence':
            fig.colorbar(sm, ax=ax, orientation='vertical', pad=0, label='Sequence score')
        plt.show()

    # Plot graph
    plot_graph(graph, length, 1.5, 'token')
在这个图中,顶部节点存储输入令牌(因此概率为100%),而所有其他节点表示生成的令牌。尽管此序列中的每个令牌在预测时都是最有可能的,但“being”和“doctor”分别被赋予了相对较低的概率,分别为9.68%和2.86%。这表明我们预测的第一个令牌“of”可能不是最合适的选择,因为它导致了“being”,这很不常见。
在下一节中,我们将探讨集束搜索如何解决这个问题。
⚖️ 集束搜索
与只考虑下一个最可能标记的贪婪搜索不同,集束搜索考虑 $n$ 个最可能的标记,其中 $n$ 代表光束的数量。此过程重复进行,直到达到预定义的最小长度或出现序列结束标记。此时,选择具有最高总体得分的序列(或“光束”)作为输出。
我们可以修改之前的函数,以考虑 $n$ 个最有可能的标记,而不仅仅是一个。在这里,我们将保持序列得分 $\log P(w)$,它是光束中每个标记对数概率的累积和。我们通过序列长度对这个得分进行归一化,以防止偏向较长的序列(这个因子可以调整)。再次,我们将生成五个额外的标记来完成句子“我有一个梦想。”
from tqdm.notebook import tqdm

def greedy_sampling(logits, beams):
    return torch.topk(logits, beams).indices

def beam_search(input_ids, node, bar, length, beams, sampling, temperature=0.1):
    if length == 0:
        return None

    outputs = model(input_ids)
    predictions = outputs.logits

    # Get the predicted next sub-word (here we use top-k search)
    logits = predictions[0, -1, :]

    if sampling == 'greedy':
        top_token_ids = greedy_sampling(logits, beams)
    elif sampling == 'top_k':
        top_token_ids = top_k_sampling(logits, temperature, 20, beams)
    elif sampling == 'nucleus':
        top_token_ids = nucleus_sampling(logits, temperature, 0.5, beams)

    for j, token_id in enumerate(top_token_ids):
        bar.update(1)

        # Compute the score of the predicted token
        token_score = get_log_prob(logits, token_id)
        cumulative_score = graph.nodes[node]['cumscore'] + token_score

        # Add the predicted token to the list of input ids
        new_input_ids = torch.cat([input_ids, token_id.unsqueeze(0).unsqueeze(0)], dim=-1)

        # Add node and edge to graph
        token = tokenizer.decode(token_id, skip_special_tokens=True)
        current_node = list(graph.successors(node))[j]
        graph.nodes[current_node]['tokenscore'] = np.exp(token_score) * 100
        graph.nodes[current_node]['cumscore'] = cumulative_score
        graph.nodes[current_node]['sequencescore'] = 1/(len(new_input_ids.squeeze())) * cumulative_score
        graph.nodes[current_node]['token'] = token + f"_{length}_{j}"

        # Recursive call
        beam_search(new_input_ids, current_node, bar, length-1, beams, sampling, 1)

# Parameters
length = 5
beams = 2

# Create a balanced tree with height 'length' and branching factor 'k'
graph = nx.balanced_tree(beams, length, create_using=nx.DiGraph())
bar = tqdm(total=len(graph.nodes))

# Add 'tokenscore', 'cumscore', and 'token' attributes to each node
for node in graph.nodes:
    graph.nodes[node]['tokenscore'] = 100
    graph.nodes[node]['cumscore'] = 0
    graph.nodes[node]['sequencescore'] = 0
    graph.nodes[node]['token'] = text

# Start generating text
beam_search(input_ids, 0, bar, length, beams, 'greedy', 1)
该函数计算了 63 个标记和 beams^length = 5² = 25 种可能的序列的分数。在我们的实现中,所有信息都存储在图中。我们的下一步是提取最佳序列。
首先,我们确定具有最高序列分数的叶节点。接下来,我们找到从根节点到该叶节点的最短路径。沿此路径的每个节点都包含最佳序列中的一个标记。以下是我们的实现方式:
def get_best_sequence(G):
    # Create a list of leaf nodes
    leaf_nodes = [node for node in G.nodes() if G.out_degree(node)==0]

    # Get the leaf node with the highest cumscore
    max_score_node = None
    max_score = float('-inf')
    for node in leaf_nodes:
        if G.nodes[node]['sequencescore'] > max_score:
            max_score = G.nodes[node]['sequencescore']
            max_score_node = node

    # Retrieve the sequence of nodes from this leaf node to the root node in a list
    path = nx.shortest_path(G, source=0, target=max_score_node)

    # Return the string of token attributes of this sequence
    sequence = "".join([G.nodes[node]['token'].split('_')[0] for node in path])

    return sequence, max_score

sequence, max_score = get_best_sequence(graph)
print(f"Generated text: {sequence}")
生成的文本:我有一个梦想。我有一个梦想
最佳序列似乎是“我有一个梦想。我有一个梦想”,这是 GPT-2 的常见回应,尽管这可能令人惊讶。为了验证这一点,我们来绘制图表。
在此可视化中,我们将显示每个节点的序列分数,它表示该序列到该点的分数。如果 `get_best_sequence()` 函数正确,序列“我有一个梦想。我有一个梦想”中的“梦想”节点应在所有叶节点中具有最高分数。
# Plot graph
plot_graph(graph, length, beams, 'sequence')
确实,“梦想”令牌具有最高的序列得分,值为-0.69。有趣的是,我们可以在左侧看到贪婪序列“我有一个梦想是成为一名医生”的得分,其值为-1.16。
正如预期的那样,贪婪搜索导致了次优结果。但是,说实话,我们的新结果也并不是特别令人信服。为了生成更多样化的序列,我们将实现两种采样算法:top-k 和核采样。
🎲 Top-k 采样
Top-k 采样是一种利用语言模型生成的概率分布,**从 k 个最可能选项中随机选择一个标记**的技术。
举例来说,假设我们有 $k = 3$ 和四个标记:A、B、C 和 D,它们的相应概率分别为:$P(A) = 30\%$,$P(B) = 15\%$,$P(C) = 5\%$,$P(D) = 1\%$。在 Top-k 采样中,标记 D 被忽略,算法将 60% 的时间输出 A,30% 的时间输出 B,10% 的时间输出 C。这种方法确保我们优先选择最可能的标记,同时在选择过程中引入随机性元素。
引入随机性的另一种方式是温度概念。温度 $T$ 是一个范围从 0 到 1 的参数,它影响 softmax 函数生成的概率,使最可能的标记更具影响力。实际上,它只是将输入 logit 除以我们称之为温度的值
这是一张图表,展示了温度对给定输入 logit [1.5, -1.8, 0.9, -3.2] 生成的概率的影响。我们绘制了三种不同的温度值,以观察其差异。
温度为 1.0 等同于默认的 softmax,不加任何温度。另一方面,低温度设置 (0.1) 会显著改变概率分布。这在文本生成中通常用于控制生成输出的“创造性”水平。通过调整温度,我们可以影响模型生成更具多样性或更可预测的响应的程度。
现在让我们来实现 top-k 采样算法。我们将在 beam_search() 函数中使用它,通过提供“top_k”参数。为了说明该算法的工作原理,我们还将绘制 top_k = 20 的概率分布图。
def plot_prob_distribution(probabilities, next_tokens, sampling, potential_nb, total_nb=50):
    # Get top k tokens
    top_k_prob, top_k_indices = torch.topk(probabilities, total_nb)
    top_k_tokens = [tokenizer.decode([idx]) for idx in top_k_indices.tolist()]

    # Get next tokens and their probabilities
    next_tokens_list = [tokenizer.decode([idx]) for idx in next_tokens.tolist()]
    next_token_prob = probabilities[next_tokens].tolist()

    # Create figure
    plt.figure(figsize=(0.4*total_nb, 5), dpi=300, facecolor='white')
    plt.rc('axes', axisbelow=True)
    plt.grid(axis='y', linestyle='-', alpha=0.5)
    if potential_nb < total_nb:
        plt.axvline(x=potential_nb-0.5, ls=':', color='grey', label='Sampled tokens')
    plt.bar(top_k_tokens, top_k_prob.tolist(), color='blue')
    plt.bar(next_tokens_list, next_token_prob, color='red', label='Selected tokens')
    plt.xticks(rotation=45, ha='right', va='top')
    plt.gca().spines['top'].set_visible(False)
    plt.gca().spines['right'].set_visible(False)
    if sampling == 'top_k':
        plt.title('Probability distribution of predicted tokens with top-k sampling')
    elif sampling == 'nucleus':
        plt.title('Probability distribution of predicted tokens with nucleus sampling')
    plt.legend()
    plt.savefig(f'{sampling}_{time.time()}.png', dpi=300)
    plt.close()

def top_k_sampling(logits, temperature, top_k, beams, plot=True):
    assert top_k >= 1
    assert beams <= top_k

    indices_to_remove = logits < torch.topk(logits, top_k)[0][..., -1, None]
    new_logits = torch.clone(logits)
    new_logits[indices_to_remove] = float('-inf')

    # Convert logits to probabilities
    probabilities = torch.nn.functional.softmax(new_logits / temperature, dim=-1)

    # Sample n tokens from the resulting distribution
    next_tokens = torch.multinomial(probabilities, beams)

    # Plot distribution
    if plot:
        total_prob = torch.nn.functional.softmax(logits / temperature, dim=-1)
        plot_prob_distribution(total_prob, next_tokens, 'top_k', top_k)

    return next_tokens

# Start generating text
beam_search(input_ids, 0, bar, length, beams, 'top_k', 1)
这些图表很好地说明了 Top-k 采样的工作原理,所有可能选择的标记都在水平条的左侧。虽然最可能的标记(红色)在大多数情况下会被选中,但它也允许选择不太可能的标记。这提供了一个有趣的权衡,可以将序列引导到不太可预测但听起来更自然的句子。现在让我们打印它生成的文本。
sequence, max_score = get_best_sequence(graph)
print(f"Generated text: {sequence}")
生成的文本:我有一个梦想中的工作,我想
Top-k 采样找到了一个新序列:“我有一个梦想中的工作,我想”,这比“我有一个梦想。我有一个梦想”感觉更自然。我们正在取得进展!
让我们看看这个决策树与之前的有何不同。
# Plot graph
plot_graph(graph, length, beams, 'sequence')
您可以看到节点与之前的迭代有显著差异,做出了更多样化的选择。虽然这个新结果的序列分数可能不是最高的(-1.01 而不是之前的 -0.69),但重要的是要记住,更高的分数并不总是能带来更真实或更有意义的序列。
既然我们已经介绍了 Top-k 采样,那么我们必须介绍另一种最流行的采样技术:核采样。
🔬 核采样
核采样,又称 Top-p 采样,与 Top-k 采样采用不同的方法。核采样不是选择前 $k$ 个最可能的标记,而是选择一个截止值 $p$,使得**所选标记的概率之和超过 $p$**。这形成了一个“核”标记集合,从中随机选择下一个标记。
换句话说,模型按降序检查其最可能的标记,并不断将它们添加到列表中,直到总概率超过阈值 $p$。与 Top-k 采样不同,核中包含的标记数量可以因步而异。这种可变性通常会产生更多样化和更具创造性的输出,这使得核采样在文本生成等任务中很受欢迎。
为了实现核采样方法,我们可以在 `beam_search()` 函数中使用“nucleus”参数。在此示例中,我们将 $p$ 的值设置为 0.5。为了简化,我们将包含的最小标记数等于光束数。我们还将考虑累积概率低于 $p$ 的标记,而不是高于 $p$ 的标记。值得注意的是,尽管细节可能不同,但核采样的核心思想保持不变。
def nucleus_sampling(logits, temperature, p, beams, plot=True):
    assert p > 0
    assert p <= 1

    # Sort the probabilities in descending order and compute cumulative probabilities
    sorted_logits, sorted_indices = torch.sort(logits, descending=True)
    probabilities = torch.nn.functional.softmax(sorted_logits / temperature, dim=-1)
    cumulative_probabilities = torch.cumsum(probabilities, dim=-1)

    # Create a mask for probabilities that are in the top-p
    mask = cumulative_probabilities < p

    # If there's not n index where cumulative_probabilities < p, we use the top n tokens instead
    if mask.sum() > beams:
        top_p_index_to_keep = torch.where(mask)[0][-1].detach().cpu().tolist()
    else:
        top_p_index_to_keep = beams

    # Only keep top-p indices
    indices_to_remove = sorted_indices[top_p_index_to_keep:]
    sorted_logits[indices_to_remove] = float('-inf')

    # Sample n tokens from the resulting distribution
    probabilities = torch.nn.functional.softmax(sorted_logits / temperature, dim=-1)
    next_tokens = torch.multinomial(probabilities, beams)

    # Plot distribution
    if plot:
        total_prob = torch.nn.functional.softmax(logits / temperature, dim=-1)
        plot_prob_distribution(total_prob, next_tokens, 'nucleus', top_p_index_to_keep)

    return next_tokens

# Start generating text
beam_search(input_ids, 0, bar, length, beams, 'nucleus', 1)
在此图中,您可以看到核中包含的令牌数量(垂直线左侧)波动很大。生成的概率分布差异很大,导致选择的令牌不总是最可能的那些。这为生成独特和多样化的序列打开了大门。现在,让我们观察它生成的文本。
sequence, max_score = get_best_sequence(graph)
print(f"Generated text: {sequence}")
生成的文本:我有一个梦想。我打算
核采样算法生成的序列是:“我有一个梦想。我打算”,这在语义连贯性方面比贪婪采样有了显著提升。
为了比较决策路径,让我们可视化核采样生成的新树。
# Plot graph
plot_graph(graph, length, beams, 'sequence')
与 Top-k 采样一样,这棵树与贪婪采样生成的树大相径庭,显示出更多样性。Top-k 采样和核采样在文本生成时都提供了独特的优势,增强了多样性,并为输出带来了创造性。您在这两种方法(甚至贪婪搜索)之间的选择将取决于您项目的具体要求和限制。
结论
在本文中,我们深入探讨了大型语言模型(特别是 GPT-2)使用的各种解码方法。我们首先介绍了简单的**贪婪搜索**及其直接(但通常次优)选择最可能下一个标记的方法。接着,我们引入了**集束搜索**技术,它在每个步骤中考虑多个最可能的标记。尽管它提供了更细致的结果,但集束搜索有时在生成多样化和富有创意的序列方面表现不佳。
为了使过程更具变异性,我们接着介绍了**Top-k 采样**和**核采样**。Top-k 采样通过在 k 个最可能标记中随机选择来使文本生成多样化,而核采样则通过根据累积概率动态形成一个标记核来采取不同的路径。这些方法中的每一种都有其独特的优点和潜在缺点,而您项目的具体要求将很大程度上决定您选择哪种方法。
最终,理解这些技术及其权衡将使您能够更好地引导大型语言模型生成越来越真实、细致和引人入胜的文本输出。
如果您对 LLM 的更多技术内容感兴趣,可以在 Twitter 上关注我:@maximelabonne。


